In the fast-paced world of financial markets, technical traders are constantly seeking tools and techniques to gain an edge in their trading strategies. One such tool that has stood the test of time is the Fibonacci retracement. Derived from the famous Fibonacci sequence, this tool offers traders insights into potential price reversals and areas of support and resistance. In this comprehensive guide, we will delve deep into the intricacies of the Fibonacci retracement, exploring its origins, application, and effectiveness in today’s dynamic financial markets.
Understanding Fibonacci Numbers and Ratios
To truly grasp the power of the Fibonacci retracement, it’s essential to understand the underlying mathematics behind it. The Fibonacci sequence is a series of numbers where each number is the sum of the two preceding ones. Starting with 0 and 1, the sequence unfolds as follows: 0, 1, 1, 2, 3, 5, 8, 13, 21, and so on.
These numbers form ratios known as the Fibonacci ratios, which are derived by dividing one number in the sequence by the number that follows it. The most commonly used Fibonacci ratios in trading are 23.6%, 38.2%, 50%, 61.8%, and 100%. These ratios are believed to represent key levels of potential price retracement in financial markets.
The Application of Fibonacci Retracement Levels
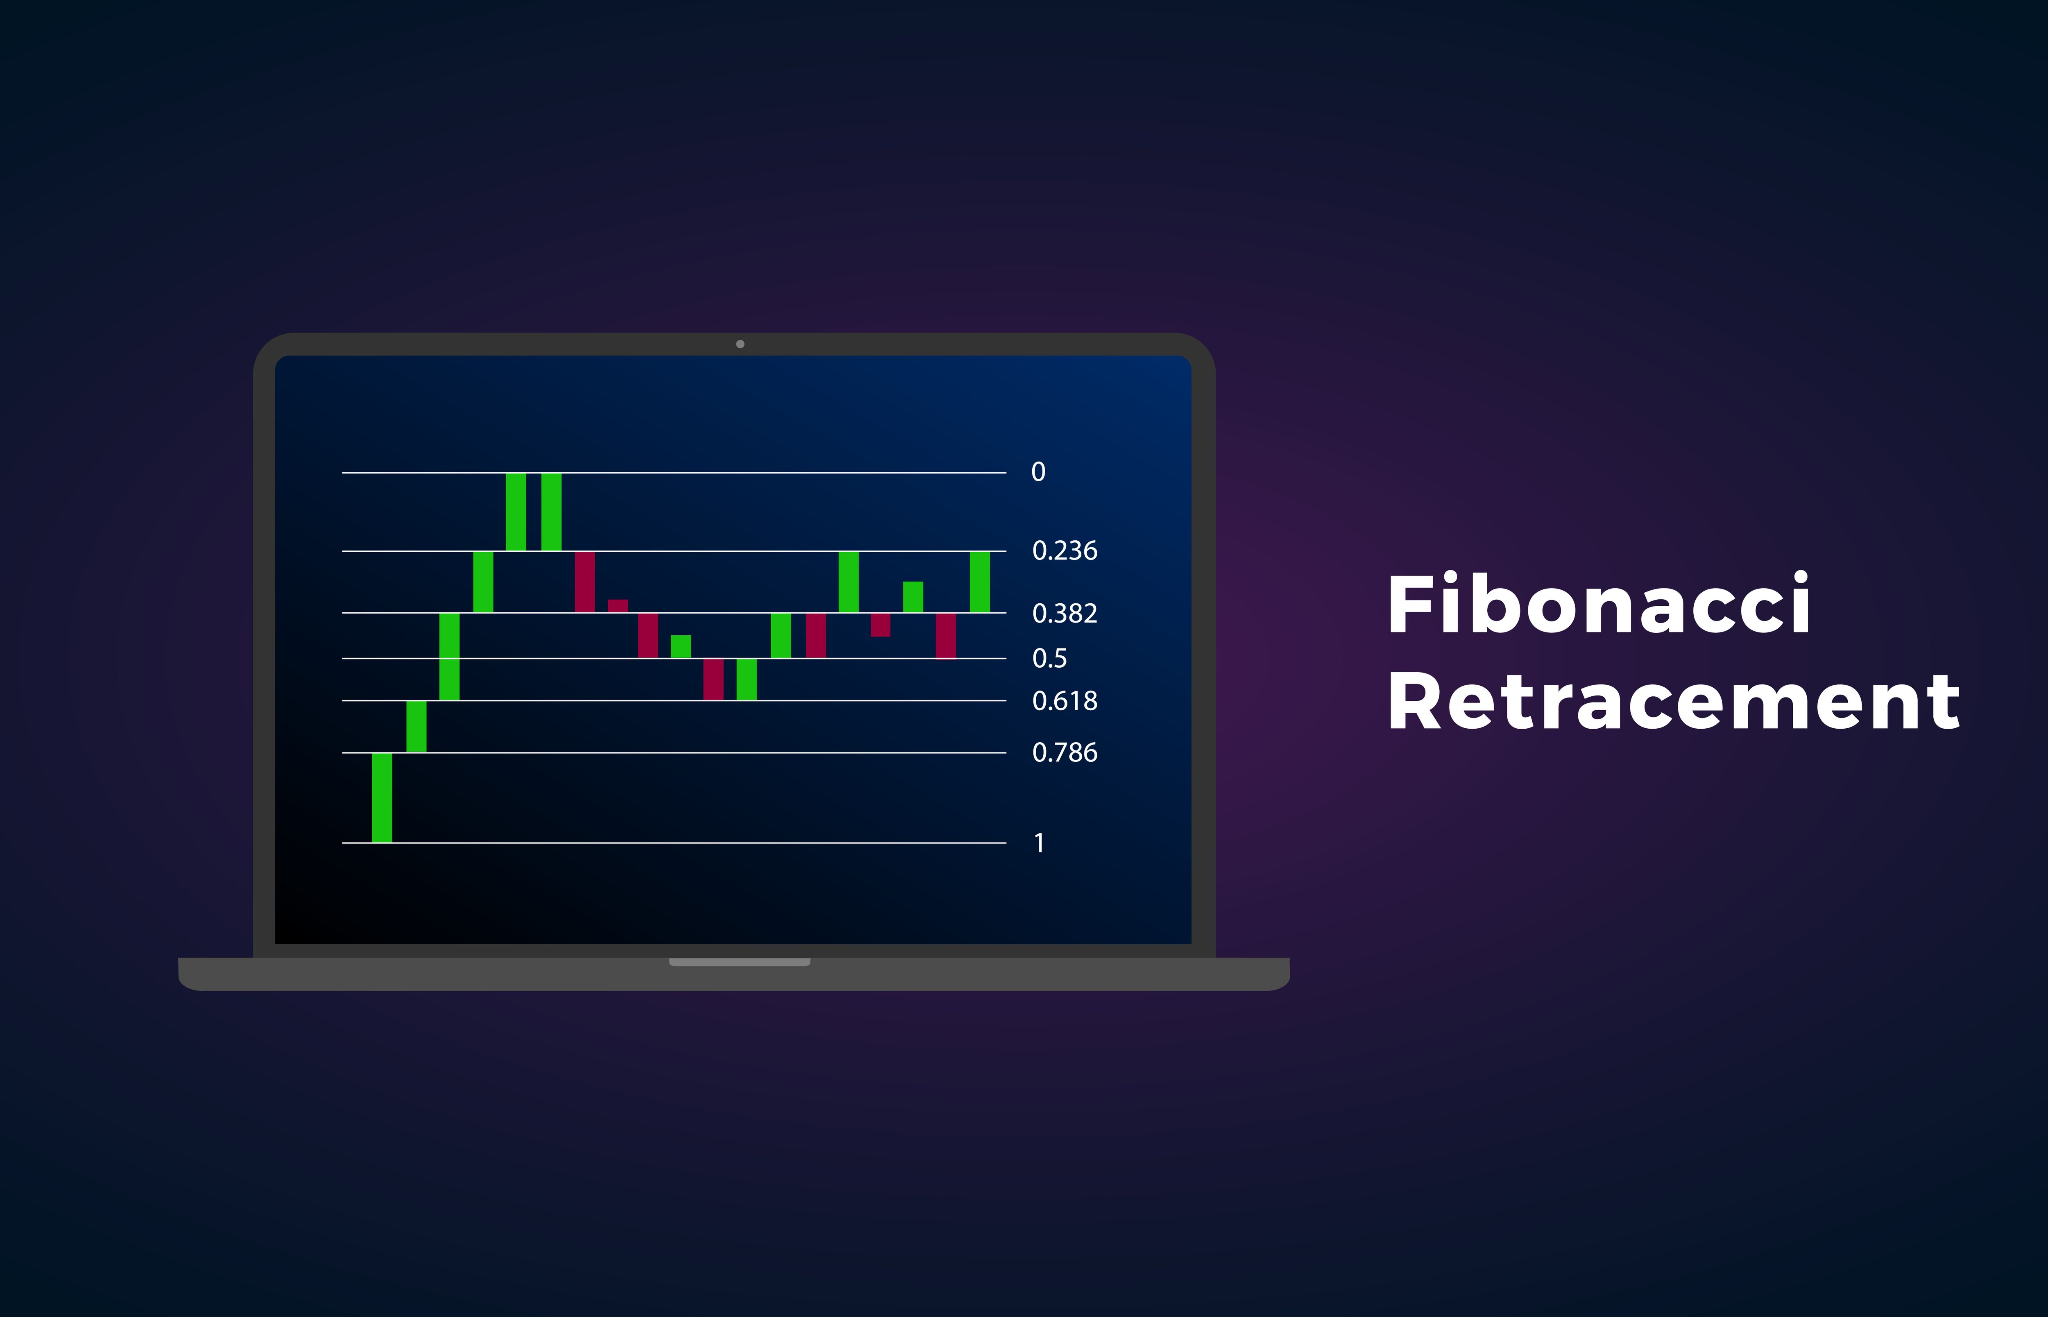
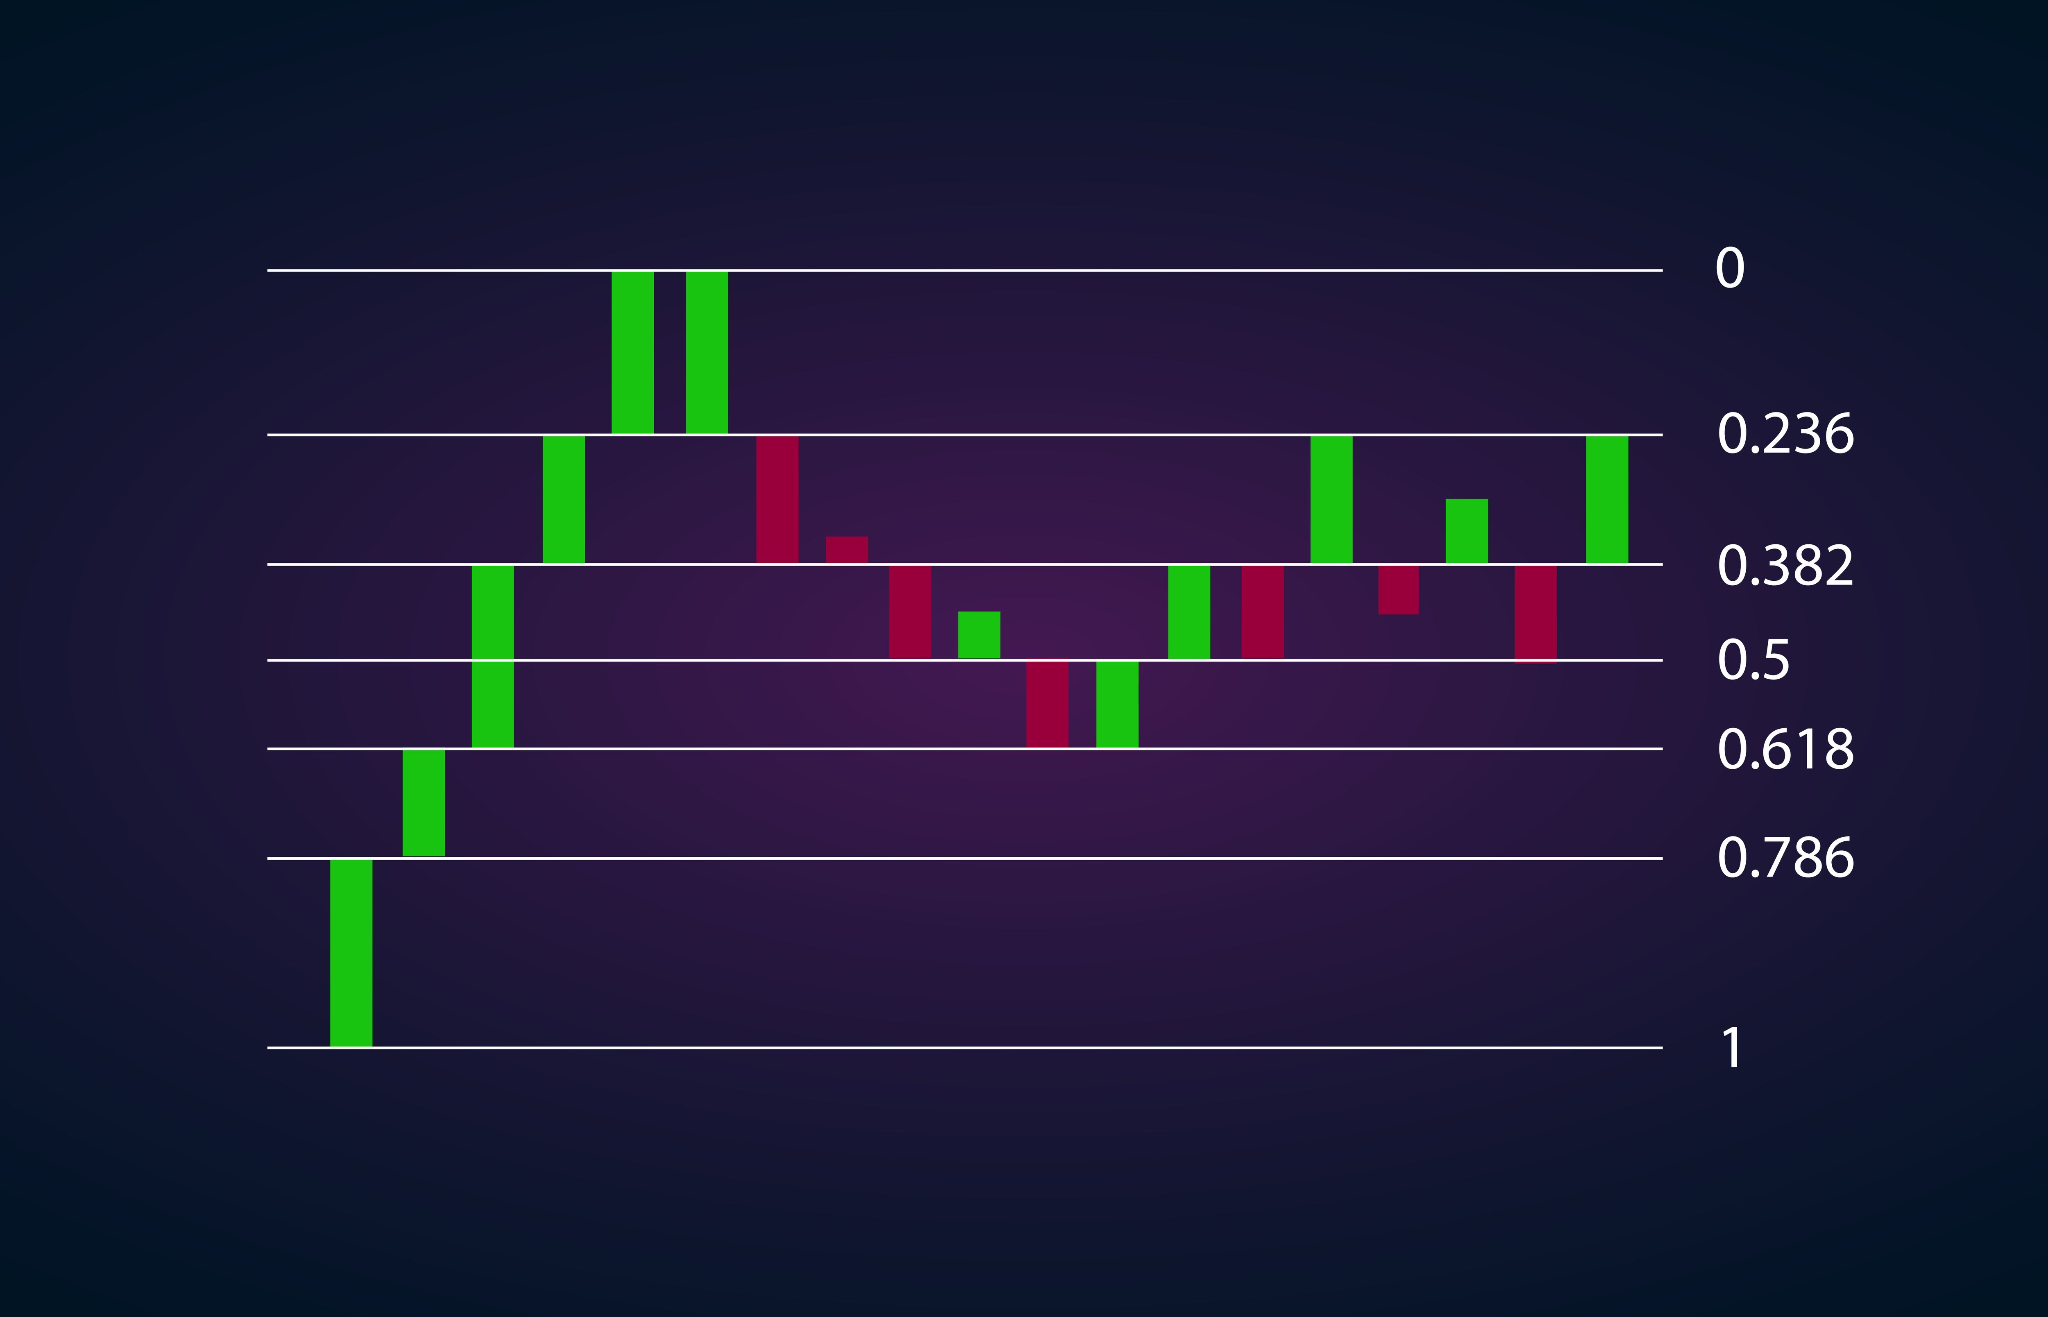
Traders utilize Fibonacci retracement levels to identify potential areas of support and resistance in a market. The process begins by identifying a significant price move, often referred to as the swing high and swing low. Traders then draw Fibonacci retracement lines from the high point to the low point (or vice versa) of the move.
The retracement levels act as critical zones where traders anticipate potential price reversals or pauses in the market trend. The 38.2%, 50%, and 61.8% retracement levels are considered particularly significant, with the 50% level often viewed as a strong level of support or resistance.
Fibonacci Retracement in Practice: A Real-World Example
To illustrate the practical application of Fibonacci retracement, let’s consider a hypothetical scenario involving a trending stock. Suppose a stock has been experiencing a strong uptrend, characterized by higher highs and higher lows. However, the stock recently experiences a pullback, causing concern among traders about the sustainability of the uptrend.
A technical trader, employing Fibonacci retracement, identifies the recent swing low and swing high points of the stock’s price movement. Drawing Fibonacci retracement lines from the swing low to the swing high, the trader identifies key retracement levels, such as the 38.2%, 50%, and 61.8% levels.
As the stock’s price retraces, the trader observes how it reacts to these Fibonacci retracement levels. If the price finds support at the 38.2% level and begins to rally, it could signal that the uptrend remains intact, and buyers are stepping in at that level. Conversely, a failure to find support at these levels may indicate a weakening trend and potential reversal.

Limitations and Considerations: A Word of Caution
While Fibonacci retracement can be a valuable tool in a trader’s toolkit, it’s essential to acknowledge its limitations and potential drawbacks. Like any technical indicator, Fibonacci retracement is not foolproof and should be used in conjunction with other forms of analysis.
Traders should also be mindful of the potential for a self-fulfilling prophecy, where widespread use of Fibonacci retracement levels by market participants can lead to price reactions at these levels simply due to their popularity.
Furthermore, the effectiveness of Fibonacci retracement may vary depending on market conditions, the timeframe being analyzed, and other contextual factors. Traders should exercise caution and conduct thorough analysis before making trading decisions based solely on Fibonacci retracement levels.
Conclusion: Harnessing the Power of Fibonacci Retracement
In conclusion, the Fibonacci retracement is a versatile tool that offers traders valuable insights into potential price levels and market dynamics. By understanding the underlying principles of Fibonacci numbers and ratios and learning how to apply Fibonacci retracement in practice, traders can enhance their trading strategies and improve their decision-making process.
While not without its limitations, Fibonacci retracement remains a widely used and respected tool among technical analysts, offering a systematic approach to identifying areas of support and resistance and anticipating market reversals. With careful application and diligent analysis, traders can harness the power of Fibonacci retracement to navigate the complexities of today’s financial markets and achieve trading success.


