In the fast-paced world of financial markets, where billions of dollars change hands every day, understanding the language of price movements is essential for traders and investors alike. Candlestick patterns, with their centuries-old history and rich symbolism, provide a unique insight into market sentiment and potential future price movements. In this article, we will delve into the fascinating world of candlestick patterns, exploring their origins, significance, and practical applications in modern trading.
The Origins of Candlestick Patterns
Candlestick charting traces its roots back to 17th-century Japan, where rice traders in the city of Osaka developed a method to track price movements in the burgeoning rice market. These early traders used simple graphical representations of price action, known as “candlesticks,” to visualize market sentiment and predict future price movements. Over time, these candlestick patterns evolved into a comprehensive system of technical analysis, with each pattern conveying valuable information about market dynamics.
Decoding Candlestick Patterns
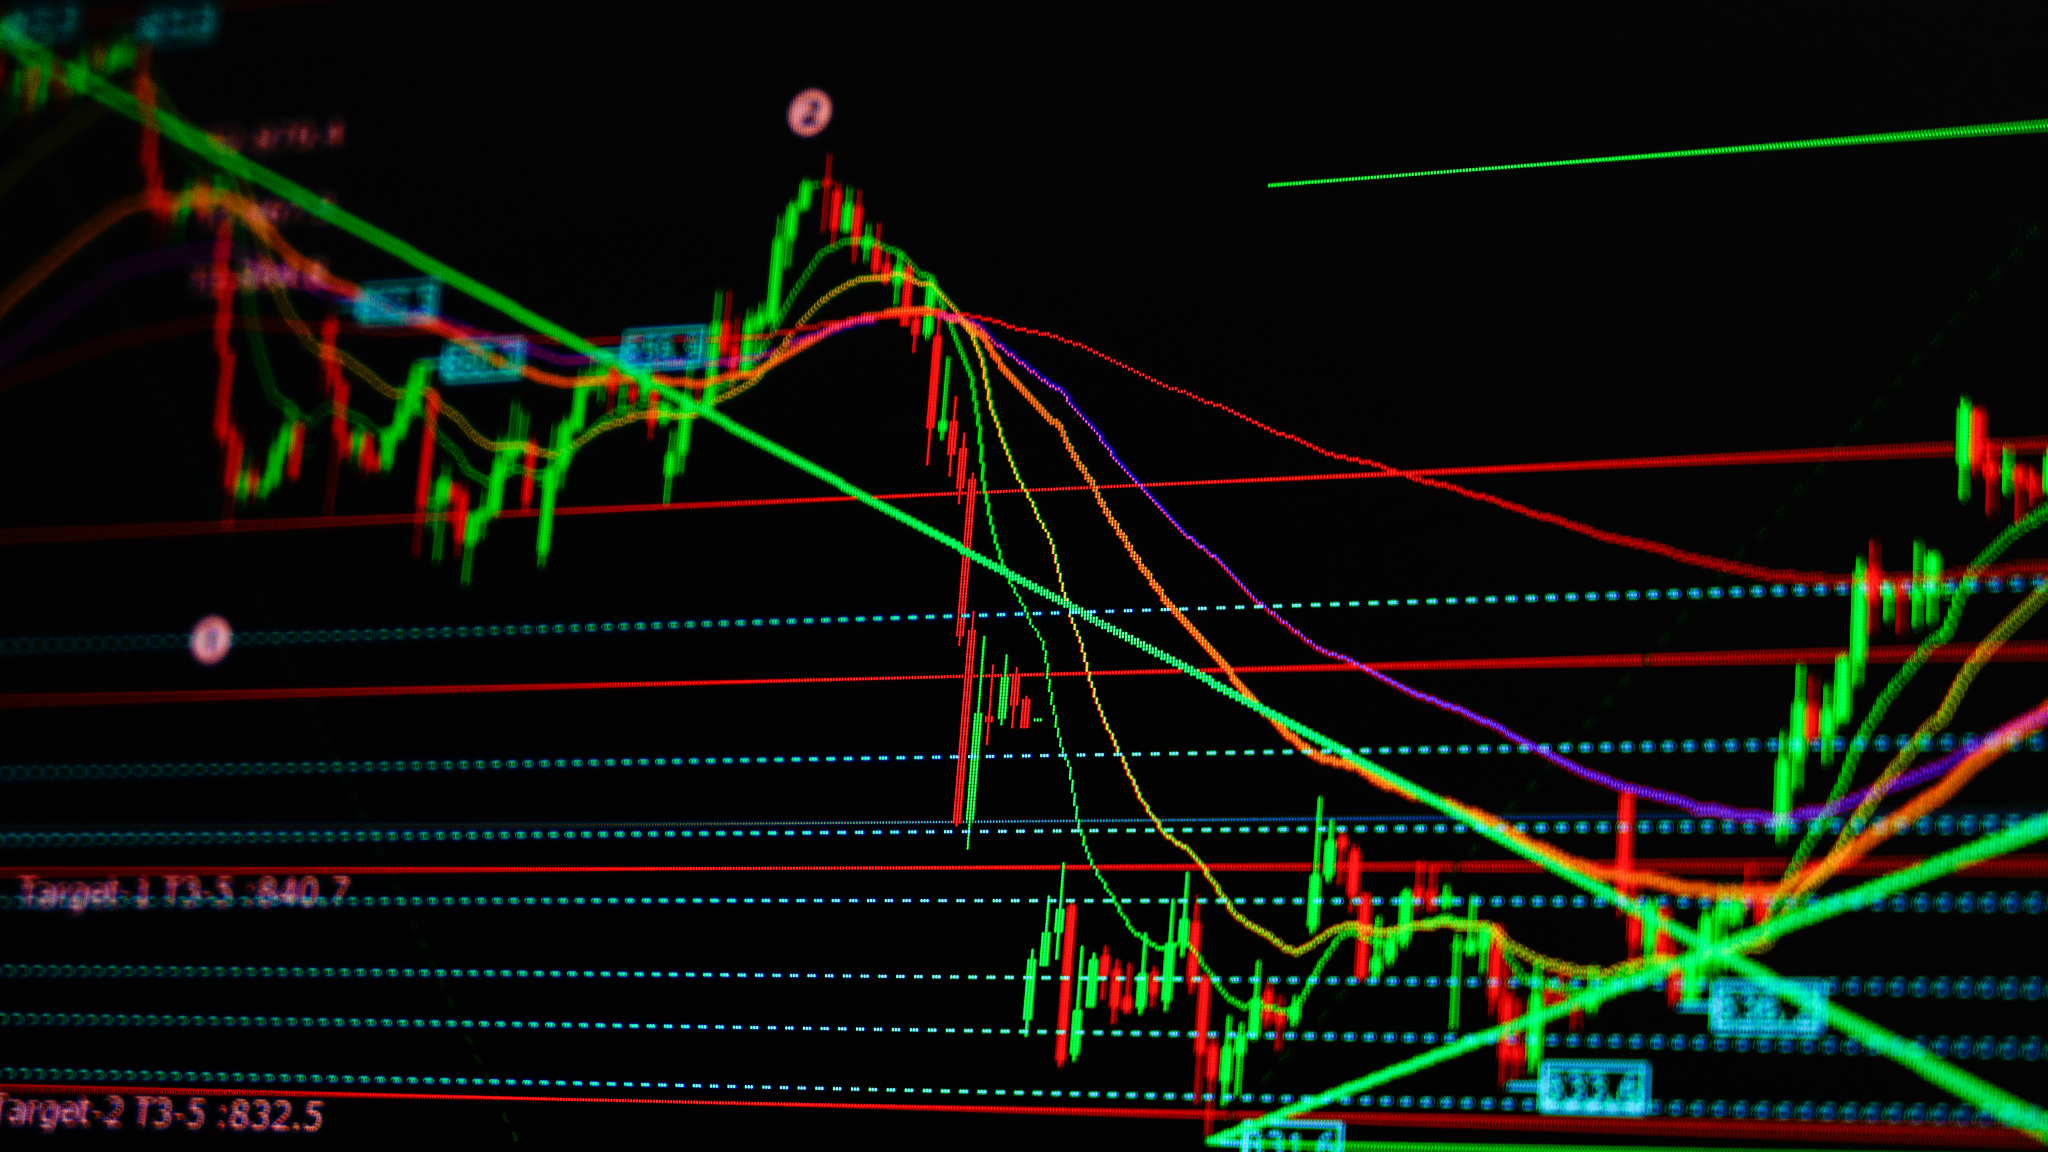
At its core, candlestick analysis relies on the interpretation of individual candlestick patterns and their combinations. Each candlestick represents a single trading session, with the body of the candle indicating the opening and closing prices and the shadows or “wicks” representing the high and low prices reached during the session. By studying the shape, size, and position of candlesticks relative to one another, traders can glean insights into market sentiment and potential trend reversals.
Bullish Patterns: Signals of Strength
Bullish candlestick patterns indicate increasing buying pressure and potential upward price movements. Examples of bullish patterns include the “hammer,” “bullish engulfing,” and “morning star.” These patterns often occur at the bottom of a downtrend and signal a potential reversal in the price direction.
Bearish Patterns: Warning Signs of Weakness
Conversely, bearish candlestick patterns suggest growing selling pressure and potential downward price movements. Examples of bearish patterns include the “shooting star,” “bearish engulfing,” and “evening star.” These patterns typically appear at the peak of an uptrend and indicate a possible reversal in the price trend.
Practical Applications in Trading
While the study of candlestick patterns may seem arcane to the uninitiated, their practical applications in trading are manifold. Traders often use candlestick patterns to identify entry and exit points, set stop-loss levels, and gauge the strength of a trend. By combining candlestick analysis with other technical indicators and fundamental analysis, traders can develop robust trading strategies with a higher probability of success.

Pattern Recognition Software: A Trader’s Best Friend
In today’s digital age, traders have access to a plethora of tools and resources to aid in their analysis of candlestick patterns. Pattern recognition software can automatically scan thousands of charts in real time, identifying potential candlestick patterns and alerting traders to trading opportunities. These advanced tools help traders stay ahead of the curve in fast-moving markets and capitalize on emerging trends.
At its core, candlestick analysis is as much about understanding human psychology as it is about interpreting price action. Each candlestick pattern reflects the collective emotions of market participants, from greed and fear to euphoria and despair. By studying these patterns, traders can gain insight into the underlying dynamics driving market movements and make informed trading decisions based on probabilities rather than emotions.
Conclusion
In conclusion, candlestick patterns represent a powerful tool in the arsenal of traders and investors, offering valuable insights into market sentiment and potential price movements. By mastering the art of candlestick analysis, traders can gain a competitive edge in the financial markets and navigate with confidence through the ebb and flow of price fluctuations. As the language of the market, candlestick patterns continue to captivate and intrigue traders around the world, transcending time and geography to unlock the secrets of market dynamics.


